Rendering maps and images
Using open source software
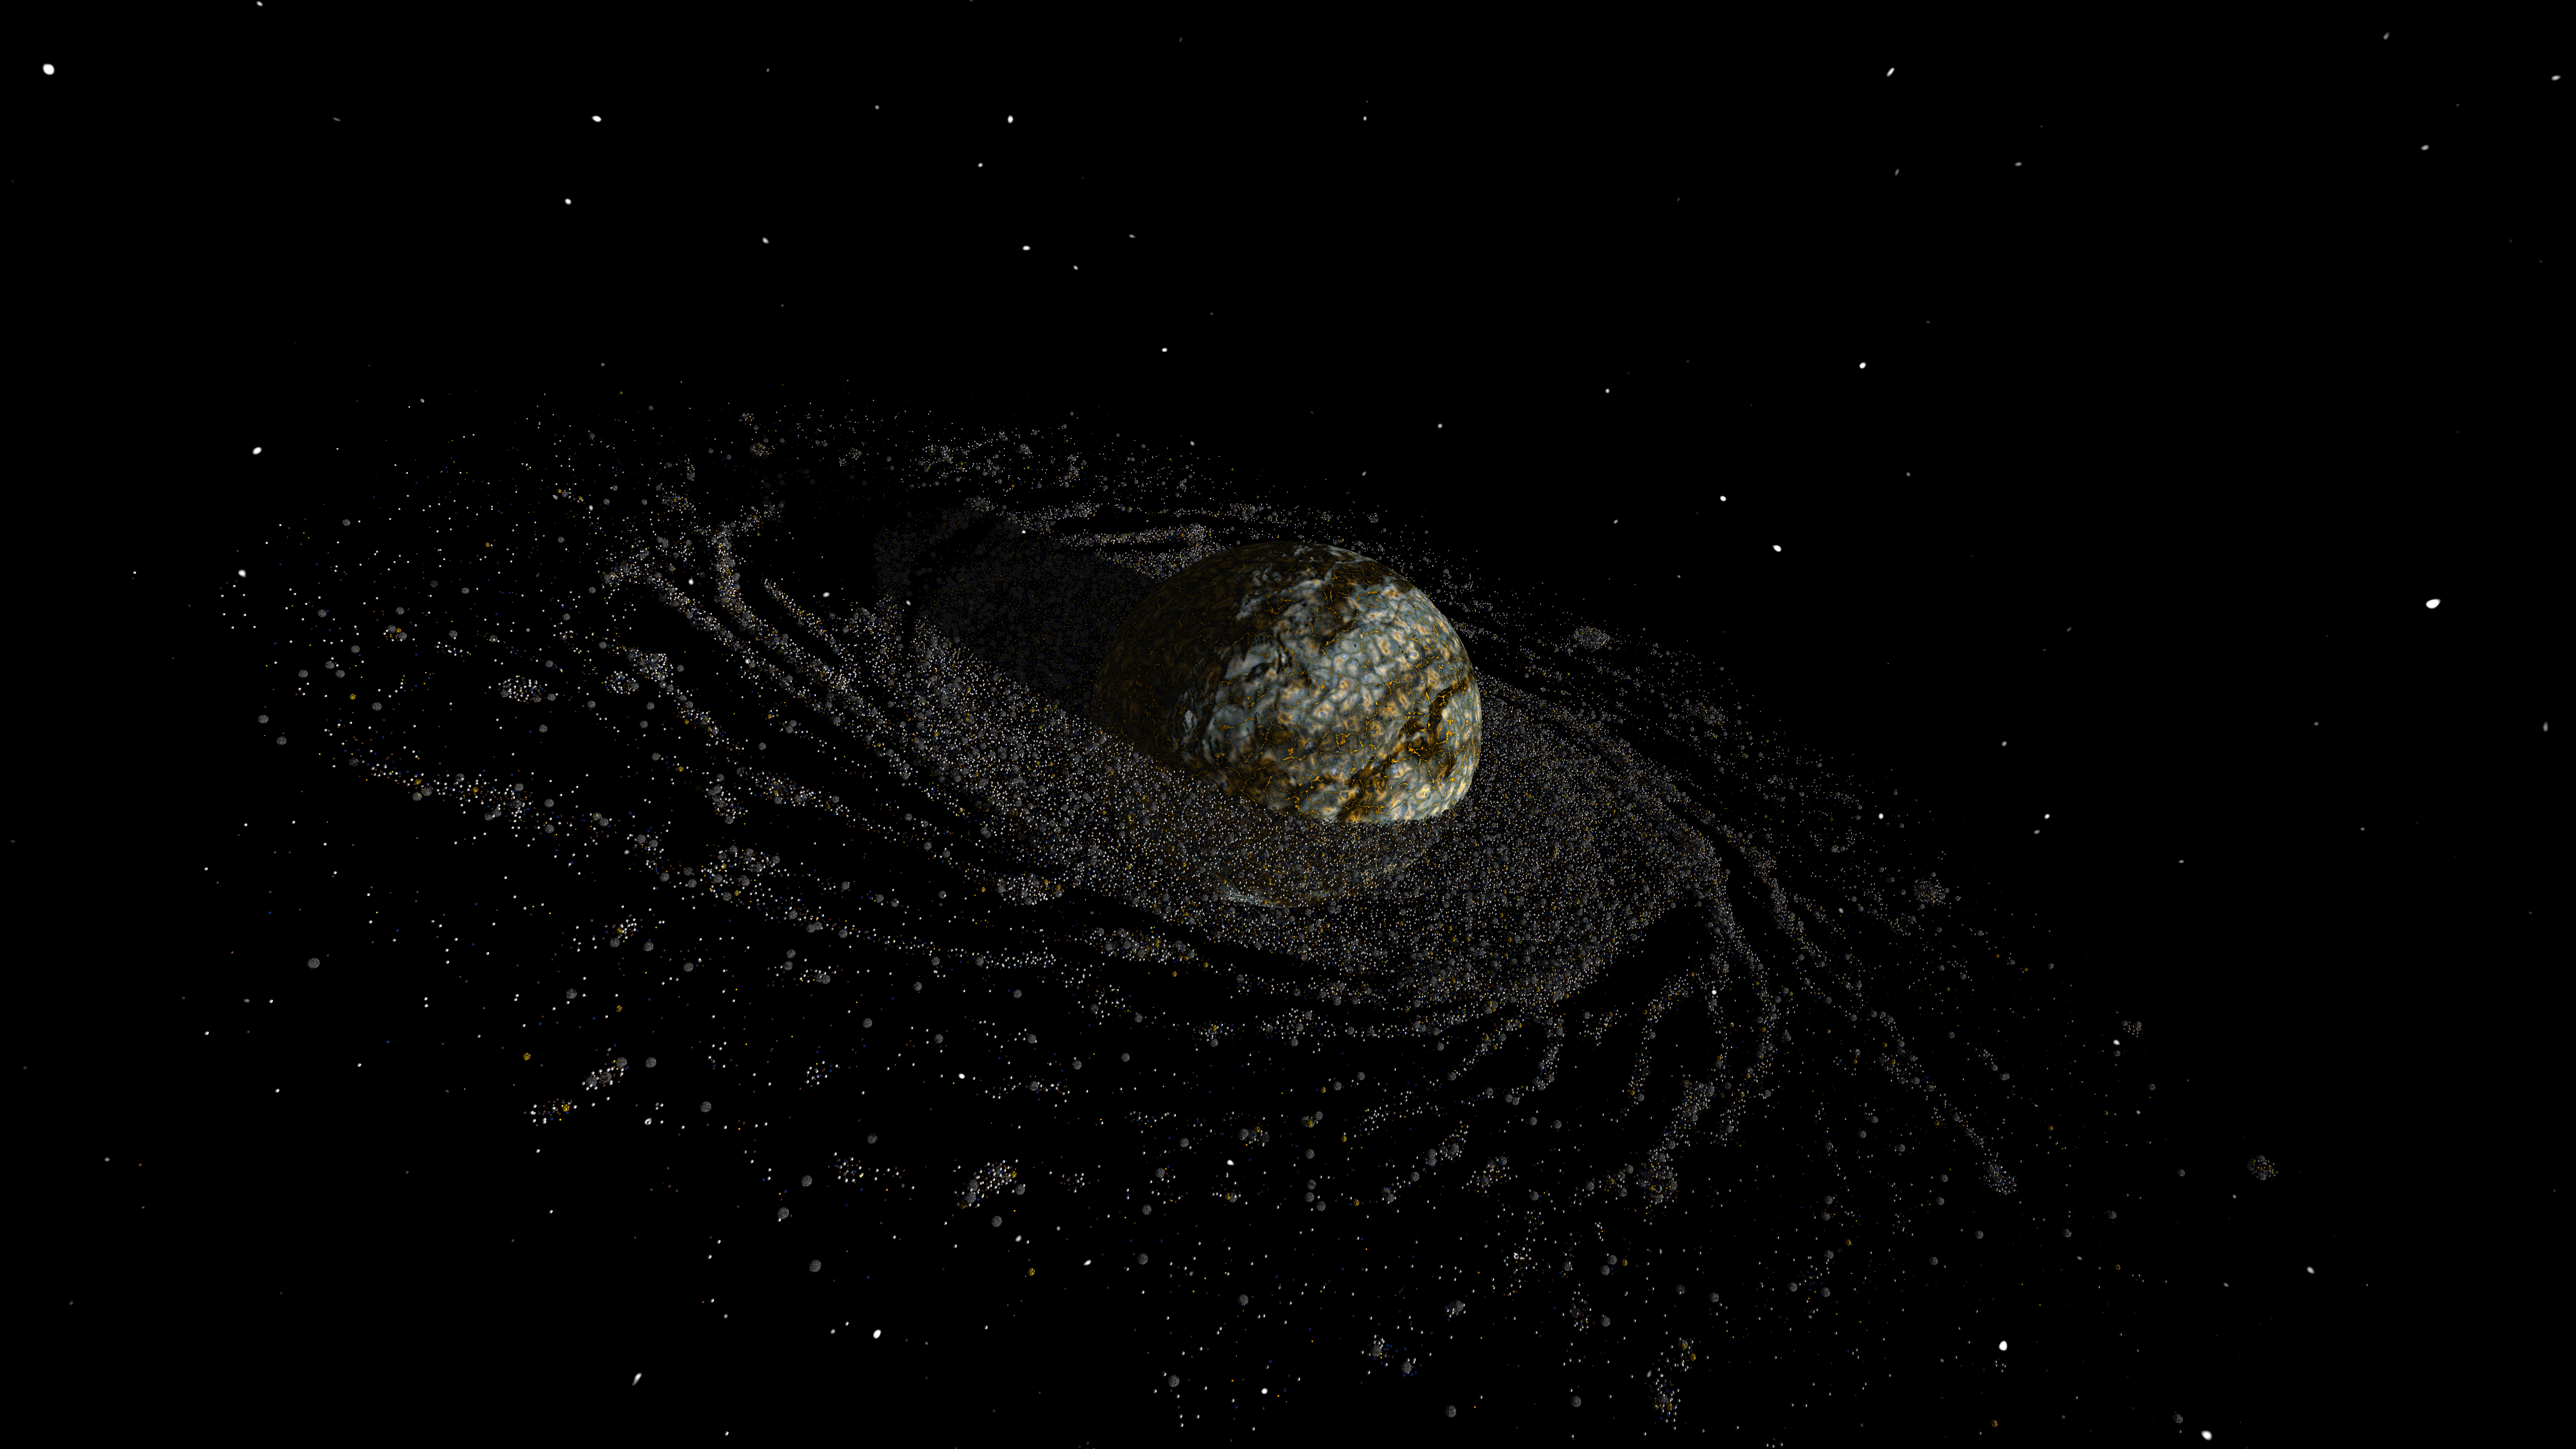
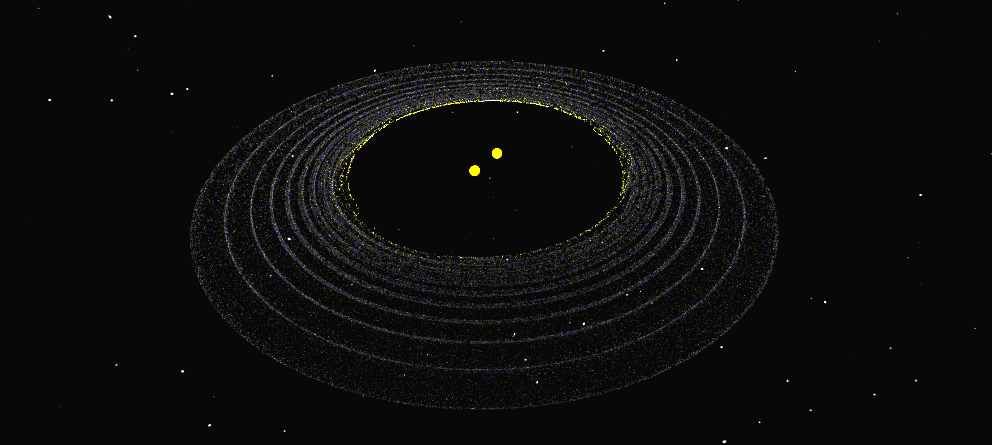
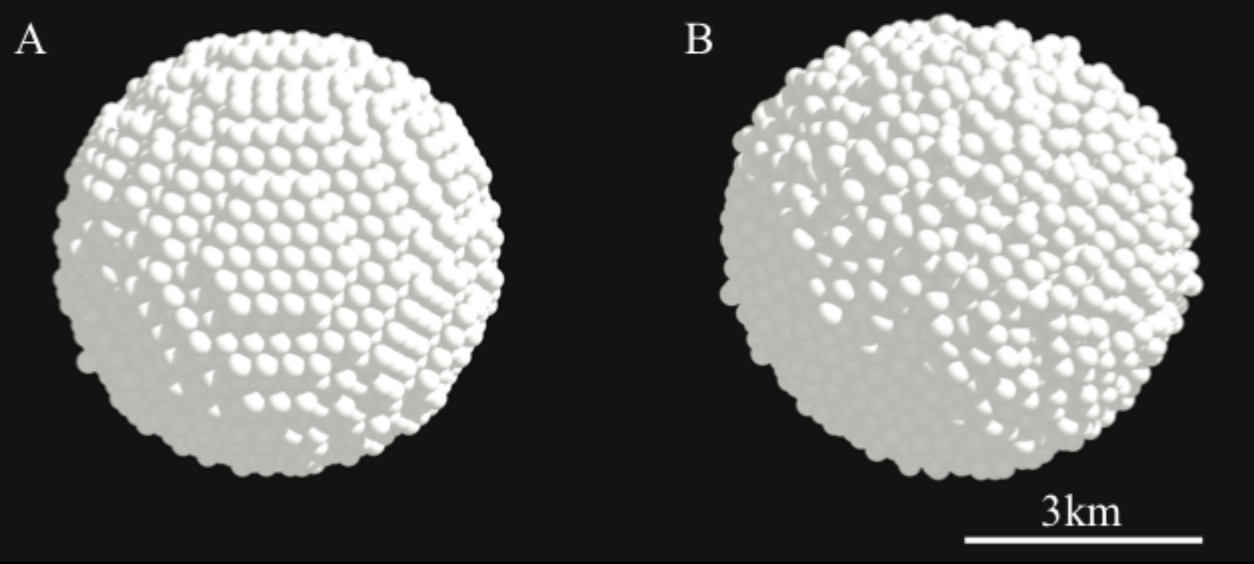
> Playing around with POV-Ray to render simulation data, generated using PKDGRAV, an N-body gravitational code written in C. Examples below include a Moon formation scenario, a planet-forming disk around a binary system with eccentricity waves, and hexagonally/randomly packed rubble-pile asteroids (see Veras et al, 2013).
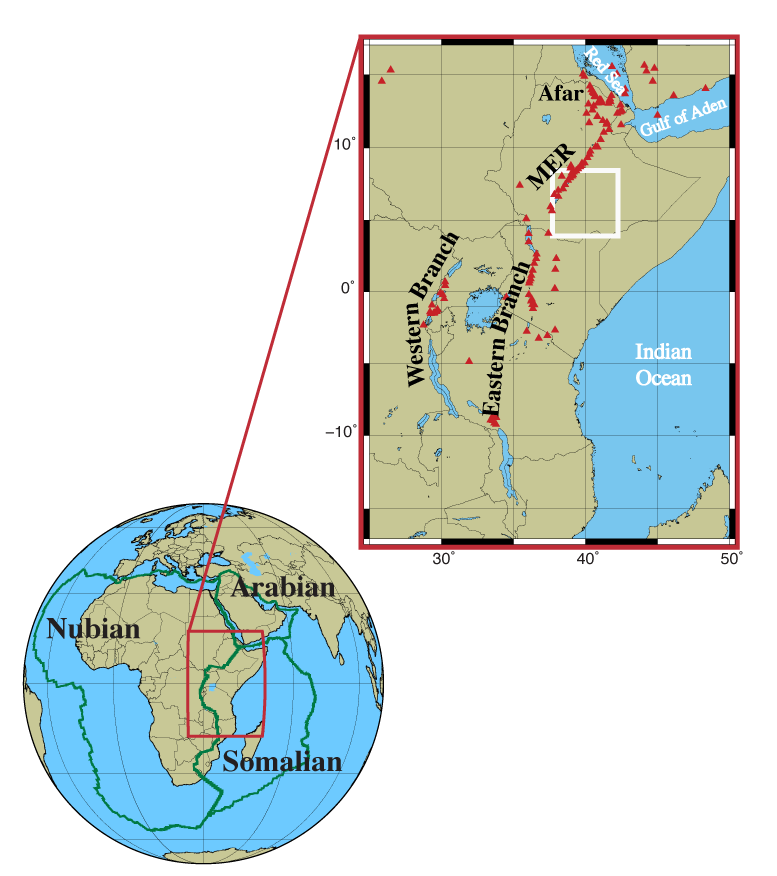
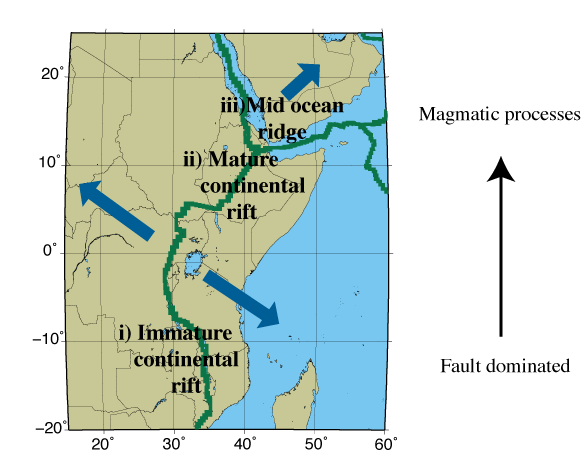
> Using Generic Mapping Tools to illustrate scientific writing:
I'm increasingly interested in questioning maps (and maps that question) – for example, where is this knowledge situated and how/can the position be revealed? How can mapping be used to connect or surveil? Whose land is it that is being mapped?
