Interferometric Synthetic Aperture Radar
Looking down – Satellite imaging of Earth
> Surveying the western branch of the East African Rift looking for earthquakes and volcanic activity
Processing and analysing Interferometric Synthetic Aperture Radar (InSAR) data using ROI_PAC and MATLAB. InSAR is a technique that uses the phase difference from two SAR images to generate maps of surface deformation. The single-antenna satellite performs a dual-pass orbit, imaging the same region at two different times:
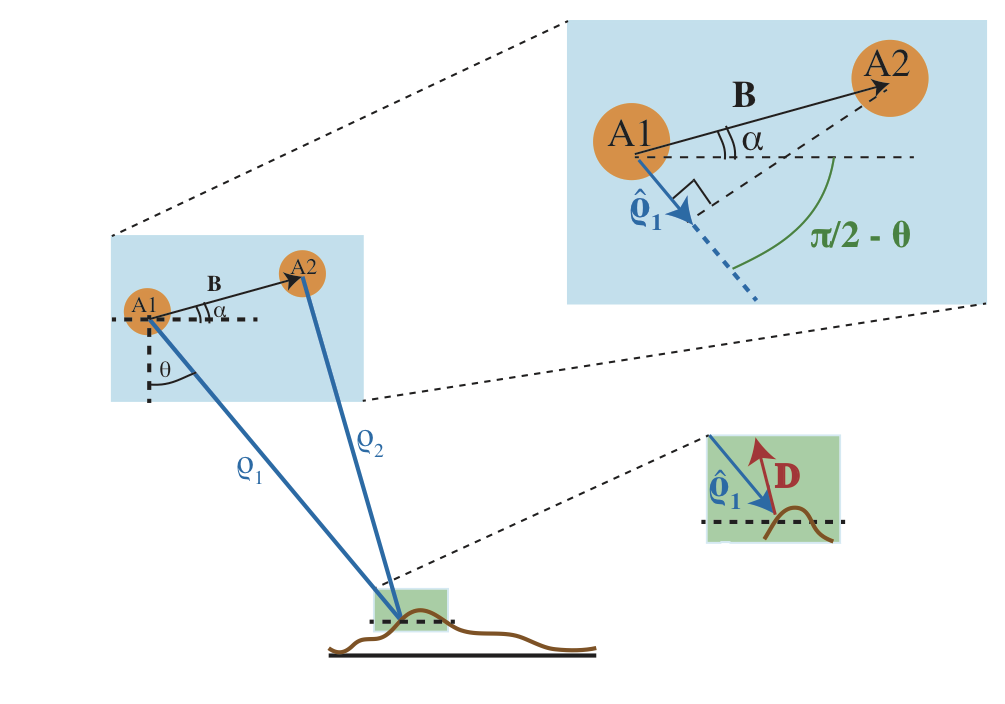
Each fringe represents a ground displacement of half the radar wavelength. InSAR typically has a spatial resolution of ~10 metres and a precision of ~millimetres.
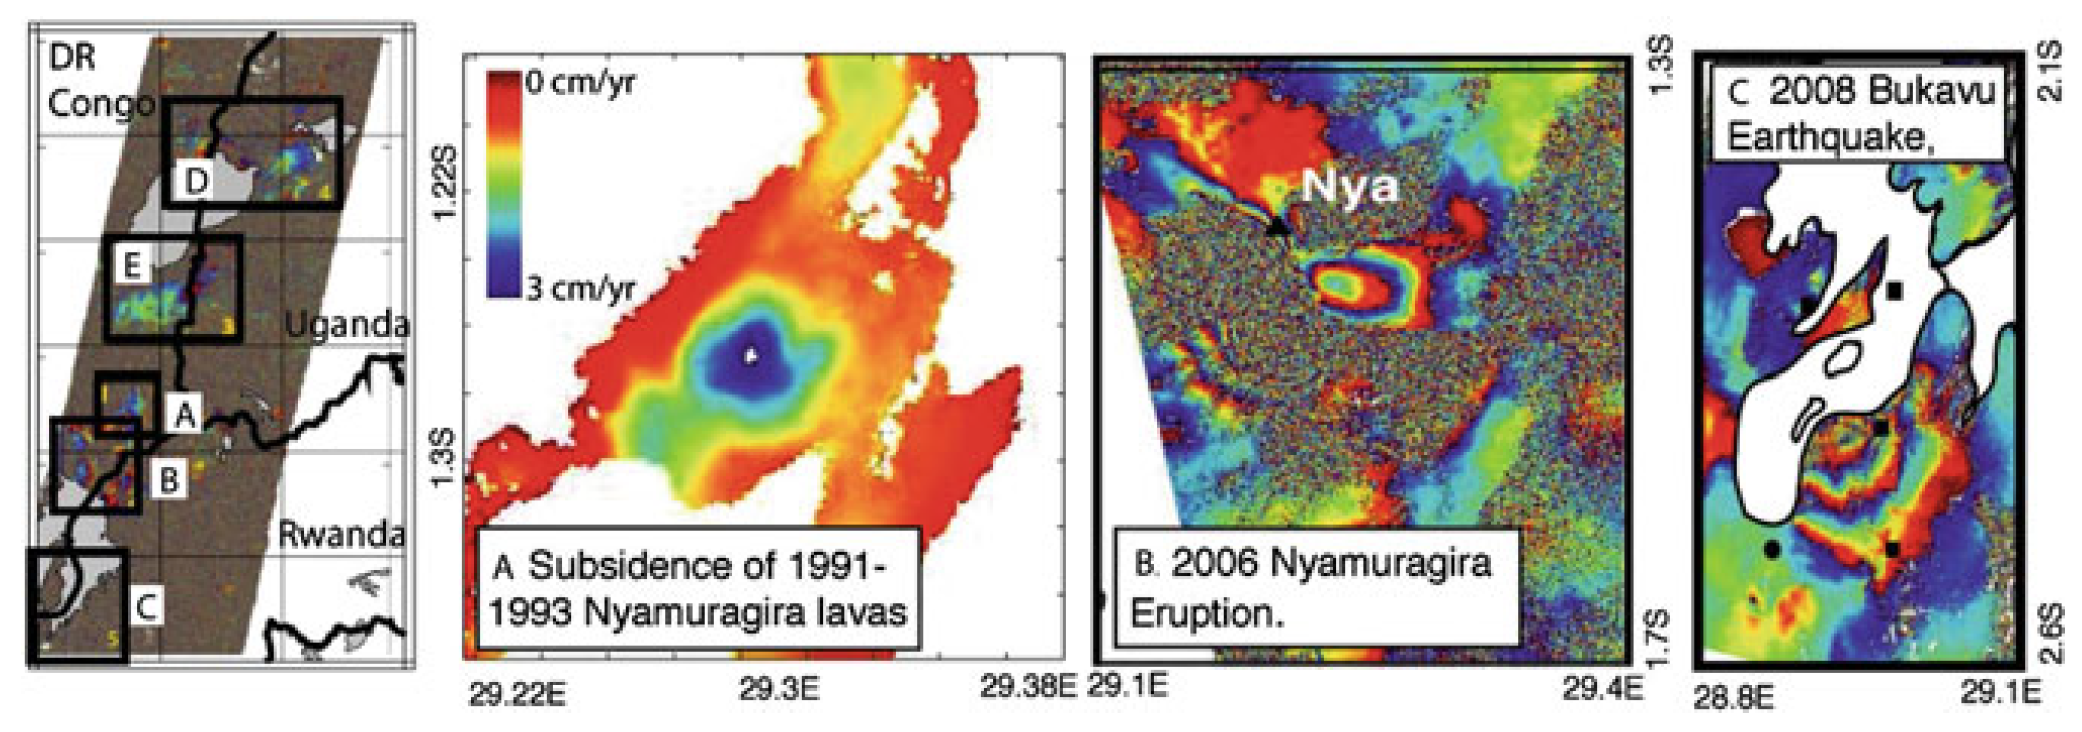
The subplots below summarise my findings: (A) Ongoing subsidence of the 1991-1993 lava flows of Nyiragongo at 3 cm/yr (B) Deformation associated with the 2006 Nyamuragira eruption (C) Deformation associated with the 2008 Bukavu Earthquake (D) An area of coherence close to the volcano May-ya-moto (E) An area of coherence around the Bunyaruguru and Katwe- Kikorongo volcanic fields, neither (D) or (E) show any deformation during the survey period.
> Investigating strain accumulation in the Main Ethopian Rift using wide-swath Interferometric Synthetic Aperture Radar
The relatively novel method of wide-swath InSAR (enabling broader ground coverage) was applied to studying the Main Ethiopian Rift (MER). The MER is a rare region where the evolution of rift development from broadly distributed to localised strain can be studied by monitoring interseismic
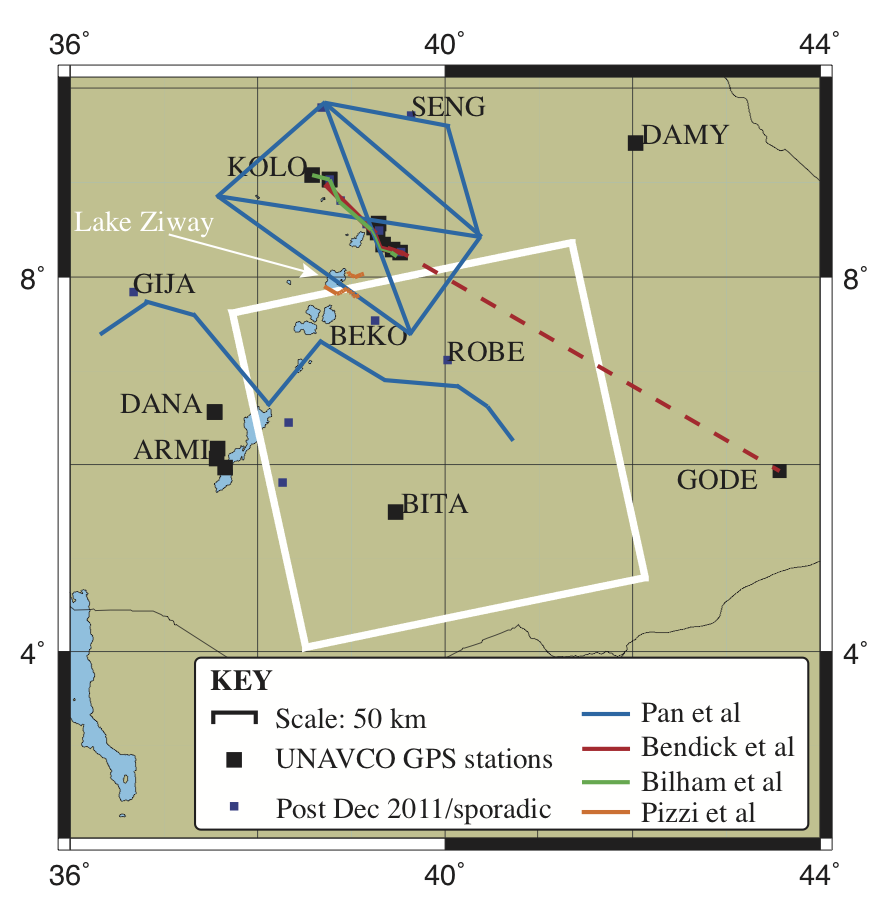
ground deformation to aid in our understanding of the fundamental geophysical mechanisms by which plate tectonics develops. Mapping shows that the GPS data of the MER region is sparse indicating the need for alternative methods, such as remote sensing:
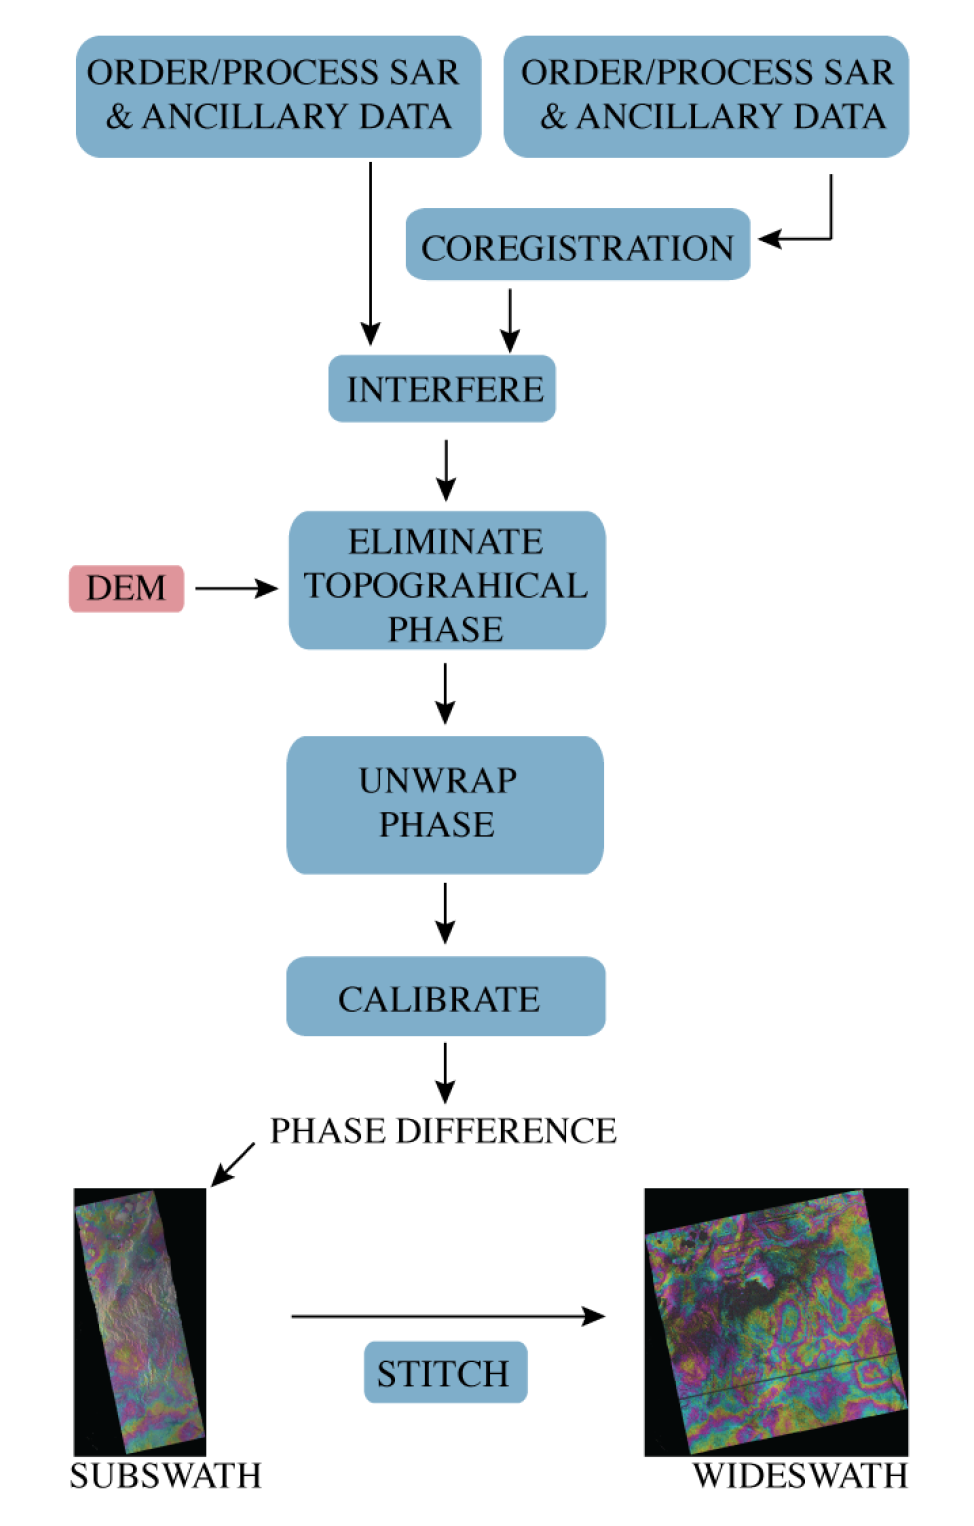
Complex data (phase + amplitude) was acquired by the C-band ASAR instrument on-board ESA's Envisat satellite in five sets of 400x400 km tracks that were stitched together. The processing pipeline for generating wideswath interferograms is sketched below.
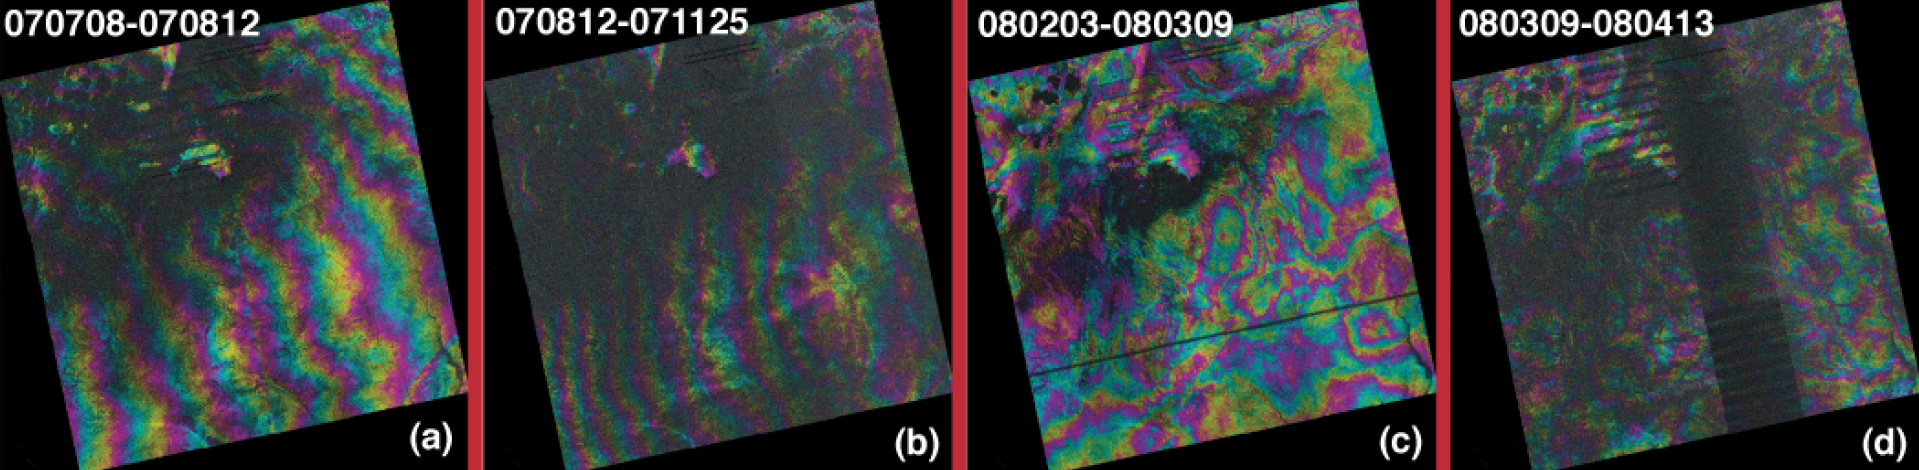
The 4 subplots (a-d) of interferograms demonstrate the various difficulties faced by this technique: long wavelength error, patchy coherence, atmospheric errors and instrument malfunction:
The coherence in the rift valley across all the available data is shown in the greyscale image below. The number of interferograms which achieved coherence (a measure of the similarity between two SAR images) in regions of interest above some threshold value is obtained by stacking.
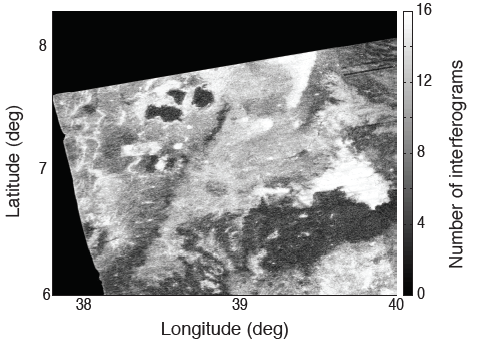
Noise levels for individual interferograms > modelled predictions by about an order of magnitude: my modelling of interseismic displacements predicted mm/year rates whereas atmospheric noise was in the range of cm/year. Stacking increased the signal-to-noise ratio, but required more data to reach model predictions.

